Senior marketers question how much weight leadership puts on some of the most familiar marketing metrics. In a 2026 survey of 120 senior brand and agency marketing leaders, Keen Decision Systems found that 25% named click-through rate the metric leadership most overrates, while 23.3% said the same about return on ad spend. Asked which single metric they would use to prove marketing success to the board, 62.5% chose a revenue number, either total revenue or incremental sales lift.
My first post argued that most marketing measurement focuses on acquisition, counting signups, sales, and opt-ins as wins, while leaving retention and trust untracked. This is the other half of that problem. A metric can reflect accurate numbers, but that doesn’t mean it directly shows what marketing contributed to profit. The key is understanding exactly what you’re measuring.
Why the Popular Metrics Mislead
A click, a view, or an impression records that eyes were on your content. This is valuable in its own right, because it reflects reach, but it doesn’t prove anything regarding profit. Bendle and Bagga, writing in MIT Sloan Management Review, show how widely used measures, including market share, net promoter score, customer lifetime value, and ROI, can mislead when managers misunderstand their definitions or draw conclusions the measures don’t support.
The confusion comes from common misconceptions versus what the metric is there to tell us.
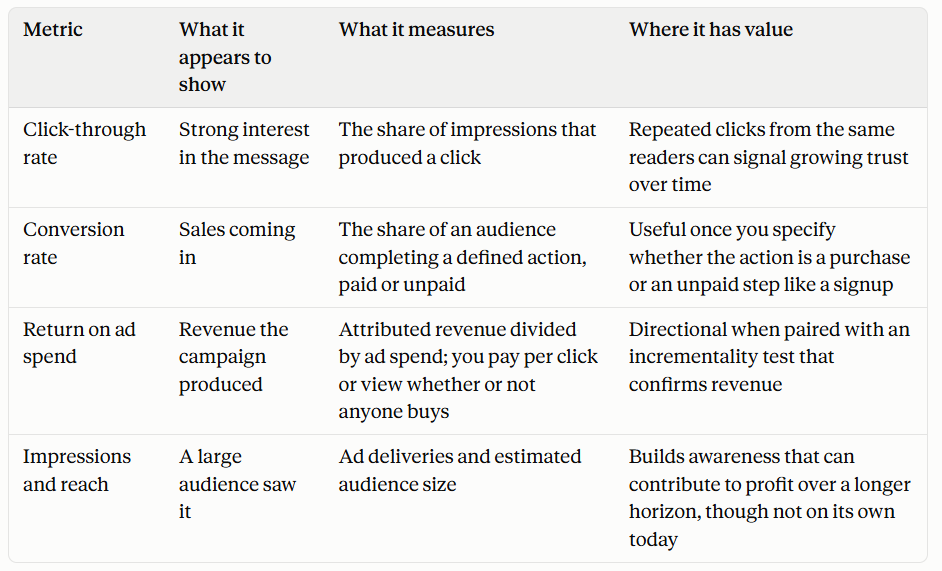
I’m not implying that any of these numbers are useless. In fact, my first post argued that trust and retention belong on the scorecard, and some of these measures indicate both. Repeated clicks from a returning audience suggest a relationship- that is, trust- is forming. Growing reach puts a brand in front of people who may buy later. I think of it as keeping your name top of mind for when the customer is ready to buy. They will think of who they’ve heard of, and research that brand first. These are early signs of trust and awareness, so we absolutely need to watch and measure them. We just don’t want to mislead on what they’re measuring. What we have there are indicators of forming relationships, not evidence of profit in hand, so they inform the story, but their best use isn’t in leading the report.
Attributed revenue is the sharpest example of a number that’s easy to mistake for proof. The revenue a platform credits to an ad isn’t necessarily revenue that ad created. Some of those customers would have bought anyway. Others were already moving toward a purchase and happened to click near the end of the journey. Last-click attribution assigns credit to the last interaction before a conversion, which can favor channels that capture existing demand over those that helped create it.
A large field experiment at eBay, published by Blake, Nosko, and Tadelis, really locked this in. When the company switched off paid search ads for its own brand terms, almost all the lost clicks returned through organic search, and sales barely moved. Conventional, non-experimental estimates had substantially overstated the ads’ causal return. The lesson here isn’t that paid search doesn’t work. It’s more about where the credit belongs. Credit assigned to a click doesn’t establish that the click itself caused the sale.
What we really want to know is whether marketing caused a change that wouldn’t have happened otherwise.
The Cost of Trusting Bad Numbers
Unreliable metrics also work against leadership in that they can inflate the budget. Sridhar, Naik, and Kelkar, in the International Journal of Research in Marketing, develop a model showing how ignoring noise in sales measures can lead to excessive advertising and promotional spending, with the overspending growing as the measures grow noisier. Their work draws on sales data from a single consumer brand across six regions, so it’s a model rather than a study of digital dashboards, but the mechanism travels. When a company can’t separate real signal from measurement error, it spends against the error.
They make a good point about overconfidence in the numbers. Managers who assume their data is reliable when it isn’t overspend. Treating noisy data as precise worsens budget decisions. The authors’ answer is to quantify how noisy a measure is and adjust spending to match. None of what I’m saying is meant to suggest eliminating a measurement. I’m arguing instead for adjustments that accurately reflect what the metrics are telling you.
What to Measure Instead
Better measurement starts with naming the outcome you want marketing to produce, then measuring that outcome directly. For most businesses, the outcome is profit and durable customer value, so the measures should be focused accordingly:
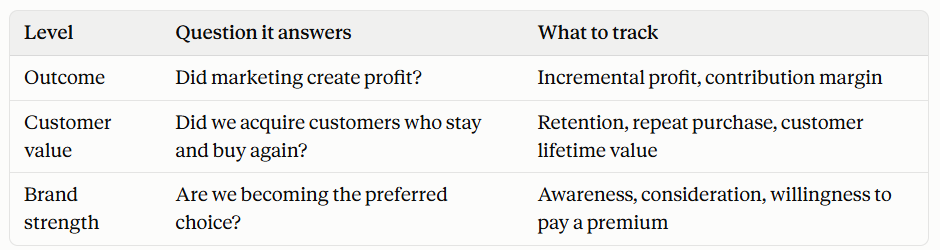
Incremental profit is the top priority here, since leadership typically cares most about that number. It measures profit after the associated costs, including the marketing spend itself. Measuring it requires comparing customers who saw the marketing with a group that didn’t. That withheld group shows what would have happened with no campaign running, so the difference between the two is what the marketing caused.
This is more workable than it sounds, even on channels where you can’t follow a single person. You don’t track one customer’s path; you split an audience into two matched groups and measure the difference. A geographic test runs the campaign in some regions and holds it back in others, then compares sales between them. A user-level holdout withholds the ads from a random share of the audience and compares the two groups’ results. Google and Meta both build this into their ad platforms through their conversion-lift tools, and the eBay experiment earlier used the geographic version, switching ads off across a third of US regions. Google’s own measurement guidance now defines incremental ROAS as incremental revenue divided by media spend, showing how far the standard has moved toward causal evidence.
A fair warning, though: this isn’t a weekly habit for most teams, and for a small business it’s often out of reach. A clean test needs enough volume to split an audience and still get meaningful numbers, the ability to withhold the campaign from one group, and a connection back to the sale on the other end. Paid channels like Google and Meta make the withholding easy, but organic social, PR, and word of mouth don’t, because you can’t choose who sees them. The realistic version for a small company is a geographic holdout on the biggest paid channel once or twice a year, backed by enough CRM discipline to see which sources attract customers. You won’t see perfect causal proof, but you’ll see numbers that better reflect what you’re looking for over a dashboard number alone.
Customer value comes next. For a company with repeat purchases, renewals, or subscriptions, cohort retention and the profit each group brings over time say more about marketing’s contribution than any click count. Edeling, Srinivasan, and Hanssens, reviewing the marketing-finance literature, tie customer equity, the expected lifetime profit from current and future customers, directly to the financial value of the firm.
Brand strength rounds out the picture. Awareness, consideration, perceived quality, and willingness to pay a premium move slowly, over months and years instead of days, as opposed to what you can see on a campaign dashboard. Tracking it relies on recurring surveys. It will shape future demand and pricing power, so measurement matters just as much, but you must measure it over time and check it against business results, not assume it.
Where to Find These Numbers
The activity numbers are easy to find, and that’s why they get so much attention. They are highlighted on every ad platform and analytics dashboard, refreshed by the hour, demanding attention. Outcome numbers take more work to assemble, so they get skipped, and the report fills up with easily accessible dashboard numbers, or vanity metrics, as I like to call them. The numbers leadership wants to see are found outside the ad platforms:
- Profit and revenue come from the accounting system, the payment processor, or whatever bookkeeping tools are used. You can find new-customer revenue, gross margin, and marketing spend there. This ledger answers whether marketing paid for itself.
- Customer value comes from the CRM and the billing or subscription platform. Retention, repeat-purchase rate, churn, and margin by cohort are built from records of who stayed, who came back, and what they spent. For a subscription or service business, this answers the question of durable value.
- Channel quality comes from tying the CRM back to the source, through UTM tags, call tracking, and a consistent source field on every lead. This is also where you define qualified demand, since you can’t read fit off a click. Capture it as the lead moves through the funnel. Use a form to ask about zip code, budget, or timeline. A sales conversation can also determine whether the lead is a fit. Behavior like a return to the pricing page signals intent. Without capture, you can report volume but not demand.
- Brand strength comes from asking. A short survey run each quarter with the same questions, to the same kind of audience, tracks awareness, consideration, and willingness to pay a premium over time. Review themes and customer interviews fill in the texture the numbers miss.
The common thread is that the outcome numbers don’t come pre-loaded. Someone has to connect the systems, define a qualified lead the same way every time, and carry a record from click-through to sale to renewal. That connective work is the difference between a report that counts activity and one that answers the question leadership thought the activity numbers were answering all along.
Reordering the Report
None of this means deleting click-through rates or ROAS from the report. Interpret these metrics alongside targeting, conversion quality, margins, and incremental results. They’re useful diagnostic inputs, but they shouldn’t stand in for evidence of business impact.
A useful order runs from spend to qualified demand to booked revenue to gross profit to retention. Lead with the profit and value measures and let the activity numbers support them. More than half the marketers in the Keen survey said they track both ends of the funnel but can’t connect awareness to conversions. At the end of the day, we want numbers that show where our marketing is working and driving profit. Vanity dashboards are easy to reach for, and many of us are still working to get past them.